Calculate your personalized 5-zone running heart rate ranges using the clinical Karvonen Heart Rate Reserve (%HRR), Tanaka (208 − 0.7 × Age), Nes/HUNT (211 − 0.64 × Age), Joe Friel Lactate Threshold (%LTHR), and MAF 180 models. Compare how resting heart rate, heat drift, and polarized 80/20 volume shape your aerobic base and race-pace workouts.
papalex-20), we may earn an affiliate commission at no extra cost to you.To calculate accurate running heart rate zones, first estimate your maximum heart rate (HRmax) using the Tanaka equation (HRmax = 208 − (0.7 × Age)) or a field test rather than the outdated 220 − Age formula. Next, subtract your morning resting heart rate (HRrest) to find your Heart Rate Reserve (HRR), and apply the Karvonen formula: Target HR = [(HRmax − HRrest) × Intensity %] + HRrest. For most runners, Zone 2 aerobic base training sits at 60%–70% of HRR (roughly 65%–75% of HRmax), while Zone 4 lactate threshold sits at 80%–90% of HRR (85%–91% of HRmax).
Interactive Running Heart Rate Zone & 80/20 Workout Calculator
Enter your age, morning resting heart rate, and preferred physiological model to generate side-by-side Karvonen (%HRR) vs. %MaxHR zones, threshold landmarks, polarized weekly volume splits, and heat-drift adjustments.
🟢 Low-Intensity Volume (Zones 1–2)
192 min/wk
Keep HR strictly below 145 bpm. Builds aerobic volume with minimal cortisol or musculoskeletal breakdown.
🟠 Quality Intensity Volume (Zones 3–5)
48 min/wk
Target 158–184 bpm across 1–2 structured sessions per week with full recovery days between.
🏃 Workout A: Aerobic Long Run
75–90 min continuous run holding 132–145 bpm. Walk steep hills if HR spikes into Zone 3.
⚡ Workout B: Threshold / VO2 Session
4 × 6 min Cruise Intervals at 158–168 bpm (2 min easy jog recovery at <130 bpm).
MAF 180 Aerobic Training Window
135–145 bpm
Calculated as (180 − Age) + Modifier. Stay within the 10-bpm window below your MAF ceiling during aerobic base blocks.
MAF vs. Karvonen Zone 2 Comparison
Your Karvonen Zone 2 ceiling is 145 bpm vs. MAF ceiling 145 bpm (0 bpm difference). Both models align closely on your First Ventilatory Threshold (LT1).
Expected Cardiac Drift at Same Pace
+9 bpm higher HR
Cutaneous vasodilation diverts blood to skin for cooling, reducing stroke volume and forcing HR upward.
Recommended Pace Adjustment to Stay in Zone 2
Slow pace by 20–30 sec/mi
During easy runs in heat, train by Heart Rate (132–145 bpm) rather than forcing cool-weather GPS pace.
1. The 5 Physiological Heart Rate Zones: Cellular Adaptations & Fuel Systems
Heart rate zones are not arbitrary speed brackets; they represent distinct metabolic states governed by autonomous nervous system balance, muscle fiber recruitment (Type I slow-twitch vs. Type IIa/IIx fast-twitch), blood lactate accumulation, and substrate oxidation (fatty acids vs. muscle glycogen). When your heart rate climbs from 60% to 90% of its reserve, your body shifts from burning predominantly lipids in oxygen-rich slow-twitch fibers to rapidly cleaving glucose via anaerobic glycolysis.
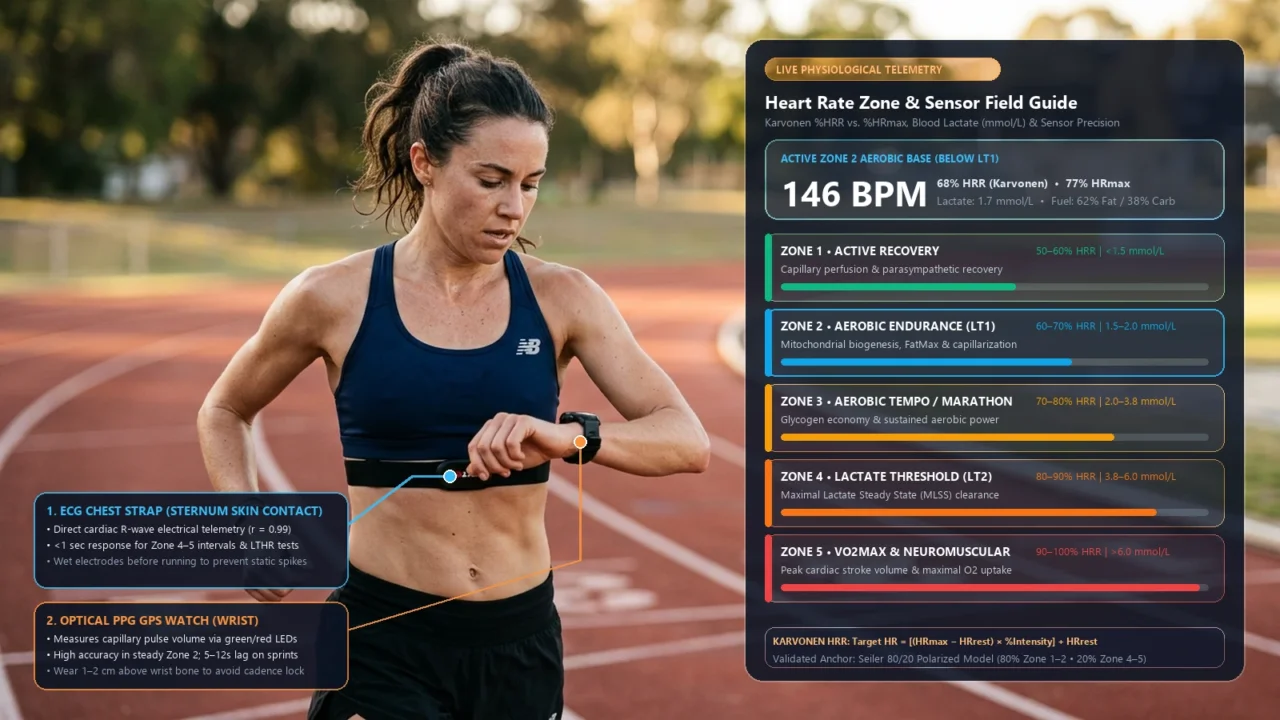
| Zone | Karvonen (%HRR) | Standard (%MaxHR) | Friel (%LTHR) | Blood Lactate | Primary Physiological Adaptation | Talk Test & RPE |
|---|---|---|---|---|---|---|
| Zone 1: Active Recovery | 50%–60% | 55%–65% | < 85% LTHR | < 1.5 mmol/L | Promotes capillary blood flow, clears metabolic byproducts, supports parasympathetic vagal recovery without structural muscle damage. | Full conversation; effortless breathing (RPE 1–2) |
| Zone 2: Aerobic Base | 60%–70% | 65%–75% | 85%–89% LTHR | 1.5–2.0 mmol/L (Up to LT1) | Maximizes mitochondrial biogenesis via PGC-1α signaling, increases capillary density around Type I fibers, and peaks lipid oxidation (FatMax). | Complete 10–12 word sentences comfortably (RPE 3–4) |
| Zone 3: Aerobic Tempo | 70%–80% | 76%–84% | 90%–94% LTHR | 2.0–3.8 mmol/L (Between LT1 & LT2) | Improves muscular endurance, glycogen economy at marathon pace, and recruitment of oxidative Type IIa intermediate muscle fibers. | Short 4–6 word phrases; controlled deep breathing (RPE 5–6) |
| Zone 4: Lactate Threshold | 80%–90% | 85%–91% | 95%–99% LTHR | 3.8–6.0 mmol/L (At LT2 / MLSS) | Upregulates MCT1 and MCT4 monocarboxylate lactate transporters, allowing working muscles and the heart to clear and oxidize lactate as fuel at fast paces. | 1–2 words at a time; “comfortably hard” (RPE 7–8) |
| Zone 5: VO2 Max Peak | 90%–100% | 92%–100% | 100%–106% LTHR | > 6.0–8.0+ mmol/L | Pushes cardiac stroke volume and central cardiac output to maximum capacity; recruits high-threshold Type IIx fibers and buffers hydrogen ion (H+) acidosis. | Cannot speak; maximal ventilation (RPE 9–10) |
2. Why the “220 − Age” Formula Fails Runners (And Which Equations Actually Work)
For decades, gym wall charts and default smartwatch algorithms relied on HRmax = 220 − Age. As exercise physiologists Robert Robergs and Roberto Landwehr demonstrated in their landmark 2002 review in the Journal of Exercise Physiology, 220 − Age was never derived from an original peer-reviewed clinical trial; it was a rough visual observation sketched by Fox et al. (1971) from 10 heterogeneous studies. In practice, 220 − Age carries a standard error of estimate (SEE) of ±10 to 12 bpm—meaning two healthy 40-year-old runners can easily have true maximum heart rates of 162 bpm and 198 bpm, respectively.
Even worse, 220 − Age systematically overestimates HRmax in young adults and severely underestimates HRmax in runners over age 40. Modern meta-analyses using maximal graded treadmill tests have established far more accurate regression models:
3. Karvonen (%HRR) vs. %MaxHR: Solving the “Smartwatch Zone 2 Gap”
One of the most common frustrations in endurance running happens when a runner leaves their GPS watch on its factory default setting (% of Max Heart Rate) and tries to run in Zone 2 (60%–70% of HRmax). Within three minutes of jogging at an easy 11:30/mile pace, their watch buzzes that they are already in Zone 3, forcing them to walk every 200 meters.
Why does this happen? Because %HRmax completely ignores your Resting Heart Rate (HRrest), which is a direct reflection of left ventricular stroke volume and aerobic conditioning. In 1957, Finnish physiologist Dr. Martti Karvonen proved that percentage of Heart Rate Reserve (HRR = HRmax − HRrest) correlates directly with percentage of VO2 Reserve (%VO2R).
Worked Mathematical Example: 38-Year-Old Runner (HRmax = 181 bpm, RHR = 48 bpm)
- Step 1 (Heart Rate Reserve):
HRR = 181 − 48 = 133 bpmof usable working range. - Default Watch Zone 2 (60%–70% of HRmax):
181 × 0.60 = 109 bpmto181 × 0.70 = 127 bpm. (For a fit runner, 127 bpm is barely a brisk walk!) - Karvonen HRR Zone 2 (60%–70% of HRR + RHR):
- Lower bound:
(133 × 0.60) + 48 = 79.8 + 48 = 128 bpm - Upper bound:
(133 × 0.70) + 48 = 93.1 + 48 = 141 bpm
- Lower bound:
- The 14-BPM Gap: Switching from default %HRmax to Karvonen %HRR shifts your true Zone 2 aerobic ceiling from 127 bpm up to 141 bpm—aligning your watch with your actual First Ventilatory Threshold (VT1 / LT1) and conversational Zone 2 running pace!
4. The 3-Zone Physiological Anchor: Understanding LT1 and LT2
While 5-zone scales are convenient for watch displays, exercise physiologists such as Dr. Stephen Seiler and Dr. Iñigo San Millán divide endurance intensity into three physiological zones separated by two metabolic thresholds:
First Lactate / Ventilatory Threshold (LT1 / VT1)
Where it sits: Top of Zone 2 (~70% HRR or ~75%–78% HRmax; blood lactate rises just above baseline at ~1.8–2.0 mmol/L).
How to feel it on the road: The Talk Test. Below LT1, you can recite a full 12-to-15-word sentence (such as the Pledge of Allegiance) without gasping mid-phrase, or breathe smoothly through a 4-steps-inhale, 4-steps-exhale rhythm. Once you cross LT1 into Zone 3, your ventilation deepens noticeably to blow off excess CO2.
Second Lactate / Ventilatory Threshold (LT2 / VT2 / MLSS)
Where it sits: Mid-to-upper Zone 4 (~85% HRR or ~87%–90% HRmax; blood lactate averages ~4.0 mmol/L, known as Maximal Lactate Steady State).
How to feel it on the road: The highest pace you can sustain in a race for roughly 50 to 60 minutes (typically 10K to 15K race pace for recreational runners, or Half Marathon pace for sub-1:20 runners). Above LT2, lactate production exceeds clearance and fatigue arrives rapidly within minutes.
5. How to Field-Test Your True LTHR and Max Heart Rate Safely
Because age-based equations still carry individual genetic variance, performing a controlled field test with a chest strap is the most reliable way to lock in your personal zones outside a sports physiology lab.
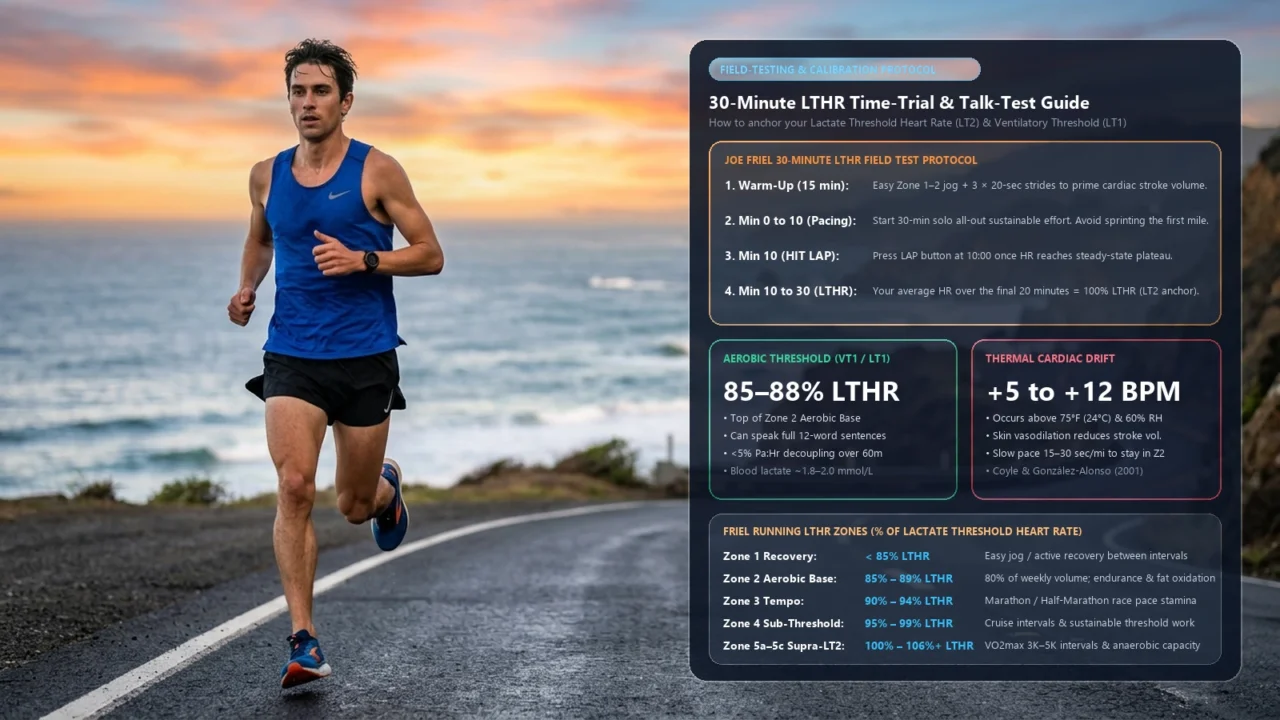
Protocol A: Joe Friel’s 30-Minute Solo Lactate Threshold (LTHR) Test (Recommended)
Determining your Lactate Threshold Heart Rate (LTHR) is safer, less taxing, and more actionable than a maximal exhaustion test because LTHR shifts upward as your fitness improves:
- Warm-Up (15 Minutes): Jog 10 minutes easy in Zone 1–2, followed by 3 × 20-second brisk strides with 40 seconds walking recovery.
- Start the 30-Minute Time Trial: On a flat track or uninterrupted paved path, begin running at the highest steady pace you can sustain for a full 30 minutes. Avoid sprinting the first mile—pace yourself evenly using our Running Pace Calculator.
- Hit the Lap Button at 10:00: Because heart rate takes 8–10 minutes to ramp up to steady-state metabolic demand, press your watch’s Lap button at the 10-minute mark.
- Finish Strong (Minutes 10 to 30): Hold your maximal sustainable effort through the final 20 minutes.
- Your LTHR Result: Your average heart rate over the final 20 minutes is your true LTHR. Enter that exact number into our calculator above (select Joe Friel 5-Zone Lactate Threshold) to generate your threshold-anchored zones.
Protocol B: Progressive 3-x-800m Hill-Finish Max HR Test
If you are healthy, well-rested, and have at least 3 months of running volume:
- Run a thorough 15-minute easy warm-up on flat ground near a moderate hill (4%–6% grade) or 400m track.
- Run 3 × 800 meters (or 3 minutes uphill) with only 90 seconds of active jogging recovery between reps:
- Rep 1: Controlled 10K effort (Zone 4).
- Rep 2: Hard 5K race effort (low Zone 5).
- Rep 3: All-out sustainable drive for the first 600m, finishing with an all-out 200-meter uphill sprint to the crest.
- The highest non-spike heart rate recorded on your chest-strap monitor during the final 30 seconds of Rep 3 (or immediately upon stopping) represents your practical running HRmax.
6. How Much Time Should You Spend in Each Zone? (80/20 Polarized vs. Pyramidal)
Research spearheaded by Dr. Stephen Seiler (2010) analyzing Olympic and recreational endurance athletes revealed a striking pattern: runners who spend 40%–50% of their week in Zone 3 (“the moderate-intensity black hole”) plateau faster and suffer higher overtraining rates than runners who follow an 80/20 intensity distribution. In an 80/20 plan, roughly 80% of weekly training sessions (or running minutes) are kept strictly in Zones 1 and 2 (below LT1), while the remaining 20% is dedicated to purposeful Zone 3, Zone 4, or Zone 5 quality work.
| Target Race / Phase | Distribution Model | Zones 1–2 (Easy Base) | Zone 3 (Marathon Tempo) | Zone 4 (Threshold) | Zone 5 (VO2 Max) | Key Weekly Quality Session |
|---|---|---|---|---|---|---|
| Off-Season / Base Building | Aerobic Foundation | 85%–90% | 5%–10% | 5% | 0% | 20-min continuous Zone 3 progression at end of easy run + 6 × 20s hill strides |
| 5K & 10K Training | Strict Polarized | 80% | 0%–3% | 10%–12% | 8%–10% | 5 × 1,000m in Zone 5 (92–97% HRR) with 2:30 jog recovery |
| Half Marathon | Pyramidal Threshold | 78%–80% | 8%–10% | 10%–12% | 2%–4% | 3 × 2 miles (3.2 km) in Zone 4 (82–88% HRR) with 2 min float |
| Full Marathon | Specific Pyramidal | 75%–80% | 14%–18% | 5%–7% | 0%–2% | Long run with final 8–10 miles in Zone 3 Marathon Pace (74–80% HRR) |
7. Setting Up Custom Zones on Your Watch & Fixing “Cadence Lock”
Once you calculate your Karvonen (%HRR) or Friel (%LTHR) zones above, do not leave your watch on its factory %MaxHR settings. Here is how to enter your exact zones and avoid optical sensor errors:
- Garmin Connect App: Open More → Garmin Devices → [Your Watch] → User Profile → Heart Rate & Power Zones → Heart Rate → Zones → Based On. Switch from
%Max. HRto%HRR(Heart Rate Reserve) or%LTHR, enter your resting and max heart rate, and set a separate Running sport profile. - Apple Watch (watchOS Workout App): Open the Watch App on iPhone → Workout → Heart Rate Zones. Switch from Automatic to Manual and type in the exact BPM bounds from the Copy Personal Zone Card button in our calculator.
- Diagnosing “Cadence Lock” on Wrist Sensors: Optical wrist sensors use green LED photoplethysmography (PPG) to measure blood volume pulses. In cool weather (when peripheral vasoconstriction narrows wrist capillaries) or when a watch bounces loosely on the ulna bone, the optical algorithm frequently locks onto your step cadence (typically 165–180 steps per minute) instead of your pulse! If your heart rate graph jumps instantaneously from 135 bpm to 172 bpm on flat ground while your breathing feels easy, tighten your watch band one notch two finger-widths above your wrist bone, or pair an ECG chest strap.
Recommended Heart Rate Monitoring Gear for Zone Training
If you train by heart rate zones—especially for Zone 2 aerobic base runs or short Zone 4/5 intervals where wrist optical sensors lag by 15 to 30 seconds—these two verified tools provide the cleanest physiological data:
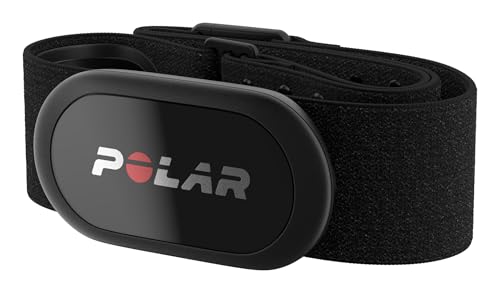
Polar H10 ECG Heart Rate Monitor Chest Strap
Unlike wrist optical PPG sensors that lag during intervals or lock onto running cadence in cold weather, the Polar H10 measures actual electrical cardiac depolarization (ECG) with millisecond R-R interval precision. Dual Bluetooth + ANT+ connectivity pairs simultaneously with Garmin, Apple Watch, COROS, and treadmill consoles.
Best for: Field LTHR testing, Zone 2 accuracy, and HRV tracking • Skip if: You strongly dislike chest straps (consider an optical upper-arm band instead).
Check Polar H10 on Amazon →
Garmin Forerunner 265 Running Smartwatch
Supports independent Running Heart Rate Zones configured by %MaxHR, Karvonen %HRR, or %LTHR, with audible/vibration zone alerts, multi-band GPS pacing, overnight HRV status, and automatic Lactate Threshold detection when paired with a chest strap.
Best for: Structured 80/20 zone workouts and marathon training • Read more: See our full Garmin Forerunner 265 review.
Check Garmin Forerunner 265 on Amazon →8. Frequently Asked Questions About Running Heart Rate Zones
Why is my heart rate in Zone 3 or Zone 4 even when I jog as slowly as possible?
Three factors typically cause this: (1) Your watch is using default %MaxHR zones instead of Karvonen %HRR, which sets your Zone 2 ceiling 10–16 bpm too low; (2) You are running in heat/humidity or up mild inclines where cardiac drift elevates HR; or (3) If you are a newer runner, the biomechanical transition from walking to a flight-phase jog demands a jump in oxygen uptake (VO2). Using run-walk intervals (e.g., 3 minutes easy jog / 1 minute brisk walk) keeps average heart rate inside Zone 2 while your capillary and mitochondrial density adapt over 6–10 weeks.
Which heart rate zone burns the most fat vs. the most total calories?
Zone 2 (60%–70% HRR) burns the highest percentage of calories from fat (roughly 60%–70% lipid oxidation, known as FatMax). Waiting until Zone 4 or Zone 5 shifts your body to burning 85%–100% carbohydrates (glycogen), though higher speeds burn more total calories per minute. Use our Running Calorie Calculator to compare exact fat vs. carbohydrate grams oxidized at any pace.
What is Cardiac Drift and when should I worry about it?
Cardiac drift is the gradual upward creep in heart rate (often 5 to 12 bpm) after 30–60 minutes of running at a constant pace, caused by sweat fluid loss (which reduces blood plasma volume and stroke volume), rising core temperature, and slow-twitch muscle fiber fatigue. A drift under 5% over a 60-minute steady Zone 2 run indicates strong aerobic conditioning (decoupling <5%); a drift over 7%–10% signals dehydration, heat stress, or an aerobic base that needs more easy volume.
Does beta-blocker medication or caffeine change my heart rate zones?
Yes. Beta-blockers and certain blood-pressure medications blunted maximal sinoatrial node firing and significantly lower both resting and maximum heart rate (often by 15–30 bpm), making age-predicted formulas inaccurate. Conversely, high-dose pre-workout caffeine, decongestants, poor sleep, or dehydration can elevate submaximal heart rate by 5–10 bpm. If you take cardiac medication, consult your physician and rely on the Talk Test and Rate of Perceived Exertion (RPE) rather than population formulas.
How often should I update my resting heart rate and LTHR in the calculator?
Update your Resting Heart Rate (RHR) every 4 to 6 weeks using your 7-day morning average (measured before getting out of bed or via overnight wearable tracking). As your aerobic base grows, your RHR may drop by 4–10 bpm, widening your Heart Rate Reserve. Re-test or review your Lactate Threshold Heart Rate (LTHR) every 8 to 12 weeks at the start of a new training block.
What is the difference between this 5-Zone Calculator and the Zone 2 Calculator?
Our dedicated Zone 2 Running Calculator focuses specifically on aerobic base building and low-heart-rate methodology, whereas this 5-Zone Heart Rate Calculator maps your entire training spectrum from Zone 1 recovery through Zone 3 marathon tempo, Zone 4 lactate threshold, and Zone 5 VO2max intervals.
Continue Building Your Running & Metabolic System
Pair your personalized heart rate zones with these verified GearUpToFit calculators and gear guides:
Peer-Reviewed Scientific References
- Tanaka, H., Monahan, K. D., & Seals, D. R. (2001). Age-predicted maximal heart rate revisited. Journal of the American College of Cardiology (JACC), 37(1), 153–156. PubMed: 11153730
- Karvonen, M. J., Kentala, E., & Mustala, O. (1957). The effects of training on heart rate: a longitudinal study. Annales Medicinae Experimentalis et Biologiae Fenniae, 35(3), 307–315. PubMed: 13470504
- Nes, B. M., Janszky, I., Wisløff, U., Støylen, A., & Karlsen, T. (2013). Age-predicted maximal heart rate in healthy subjects: The HUNT Fitness Study. Scandinavian Journal of Medicine & Science in Sports, 23(6), 697–704. PubMed: 22376273
- Seiler, S. (2010). What is best practice for training intensity and duration distribution in endurance athletes? International Journal of Sports Physiology and Performance, 5(3), 276–291. PubMed: 20861519
- Robergs, R. A., & Landwehr, R. (2002). The surprising history of the “HRmax=220-age” equation. Journal of Exercise Physiology Online, 5(2), 1–10.
- Gulati, M., et al. (2010). Heart rate response to exercise stress testing in asymptomatic women: The St. James Women Take Heart Project. Circulation, 122(2), 130–137. PubMed: 20585008
- San-Millán, I., & Brooks, G. A. (2018). Assessment of metabolic flexibility by means of measuring blood lactate, fat, and carbohydrate oxidation responses to exercise in professional endurance athletes and less-fit individuals. Sports Medicine, 48(2), 467–479. PubMed: 28623613