| Belt Incline | Equivalent Pace Effort | VO2 Demand (mL/kg/min) | MET Level | Net Calories | Gross Calories | Vertical Gain |
|---|
Glycogen (Carbohydrate) Oxidized
Depletes ~0% of typical 500g muscle + liver glycogen stores.
Adipose & IMTG Fat Oxidized
Stoichiometric lipid oxidation at 9.45 kcal per gram of fat.
In-Run Fueling & Hydration Target
Estimated sweat loss and fluid replacement guidance.
Weekly Net Running Burn
Across 20.0 miles per week of running.
Effective Fat Loss (4 & 12 Weeks)
After accounting for appetite compensation and 3,500 kcal/lb tissue density.
Distance to Burn 1 lb (3,500 Net kcal)
Based on your exact body weight, terrain, and slope cost.
Live Physiological Expenditure Breakdown
Quick Answer: How Many Calories Does Running Burn?
On flat pavement, running burns an average of 1.00 to 1.04 net kilocalories per kilogram of body weight per kilometer (roughly 0.73 to 0.75 net kcal per pound per mile). That means a 165-pound (75 kg) runner burns ~107 to 112 net calories per mile (or ~119 to 125 gross calories per mile including resting metabolism). Over a 5K (3.1 miles), a 165-lb runner expends approximately 335 net calories; over 5 miles, 536 net calories; and over a 26.2-mile marathon, approximately 2,810 net calories.
While net calories burned per mile stay remarkably consistent across moderate aerobic paces because running economy is roughly linear with velocity (Margaria et al., 1963), calories burned per minute rise sharply with faster speeds, steeper uphill grades, heavier body mass, and softer terrain like trail or sand.
Net Calories vs. Gross Calories: Why Your GPS Watch Inflates Your Burn
When you finish a 45-minute run and look down at your wrist, most consumer smartwatches report Gross Calories—the sum of the energy required to propel your body forward plus the basal resting energy your organs would have consumed if you had spent those 45 minutes lying on the sofa. Exercise physiologists and sports dietitians instead prioritize Net Running Calories.
- Gross Running Calories (Total Energy Expenditure): Calculated from total oxygen consumption (VO2 gross), where 1 MET = 3.5 mL O2•kg−1•min−1 represents resting metabolic rate. During a 45-minute run at 10.2 METs, roughly 9.8% of the gross calorie number is simply your baseline resting metabolism.
- Net Running Calories (Active Exercise Cost): Isolates the true mechanical and metabolic cost added by the run itself by subtracting 1.0 MET (3.5 mL O2•kg−1•min−1) from total oxygen uptake before converting to kilocalories.
If you use a Total Daily Energy Expenditure (TDEE) calculator or a Resting Metabolic Rate (RMR) tool to set your daily calorie target, your resting calories for all 24 hours of the day are already counted in your baseline. Adding Gross running calories on top of your BMR double-counts your resting metabolism for the duration of the workout—overestimating your daily deficit by 60 to 150 kcal per hour of running.
Calories Burned Running by Body Weight, Pace, and Distance
Because moving a larger mass against gravity requires proportionally greater ground reaction impulse during every stance phase, body weight (plus any clothing, hydration pack, or weighted vest) is the primary multiplier of running energy expenditure. The reference matrix below shows validated Net Running Calories across common body weights, speeds, and race distances on level road pavement:
| Pace (min/mi) | Speed (mph / km/h) | METs (Gross) | 130 lbs (59 kg) • 1 Mi / 5K / 30 Min | 165 lbs (75 kg) • 1 Mi / 5K / 30 Min | 200 lbs (91 kg) • 1 Mi / 5K / 30 Min |
|---|---|---|---|---|---|
| 11:00 /mi (6:50 /km) | 5.45 mph (8.8 km/h) | 8.8 METs | 86 / 267 / 235 kcal | 109 / 339 / 298 kcal | 132 / 411 / 361 kcal |
| 10:00 /mi (6:13 /km) | 6.00 mph (9.7 km/h) | 9.8 METs | 86 / 267 / 258 kcal | 109 / 339 / 327 kcal | 132 / 411 / 397 kcal |
| 9:00 /mi (5:36 /km) | 6.67 mph (10.7 km/h) | 10.5 METs | 85 / 264 / 283 kcal | 107 / 333 / 358 kcal | 130 / 404 / 433 kcal |
| 8:00 /mi (4:58 /km) | 7.50 mph (12.1 km/h) | 11.8 METs | 85 / 264 / 319 kcal | 107 / 333 / 402 kcal | 130 / 404 / 487 kcal |
| 7:00 /mi (4:21 /km) | 8.57 mph (13.8 km/h) | 12.8 METs | 85 / 264 / 365 kcal | 107 / 333 / 460 kcal | 130 / 404 / 557 kcal |
| 6:00 /mi (3:44 /km) | 10.00 mph (16.1 km/h) | 14.5 METs | 85 / 264 / 425 kcal | 107 / 333 / 536 kcal | 130 / 404 / 650 kcal |
Notice the fundamental physiological distinction in the table above: when comparing a 10:00/mile pace to a 7:00/mile pace for a 165-lb runner, the calories burned over 1 mile or a 5K remain virtually identical (~107 to 109 net kcal/mi), whereas the calories burned in 30 minutes jump by 40.7% (from 327 net kcal to 460 net kcal) because the faster runner covers 4.29 miles instead of 3.00 miles in that 30-minute window. To dial in your training splits for any distance, pair this tool with our Running Pace Calculator.
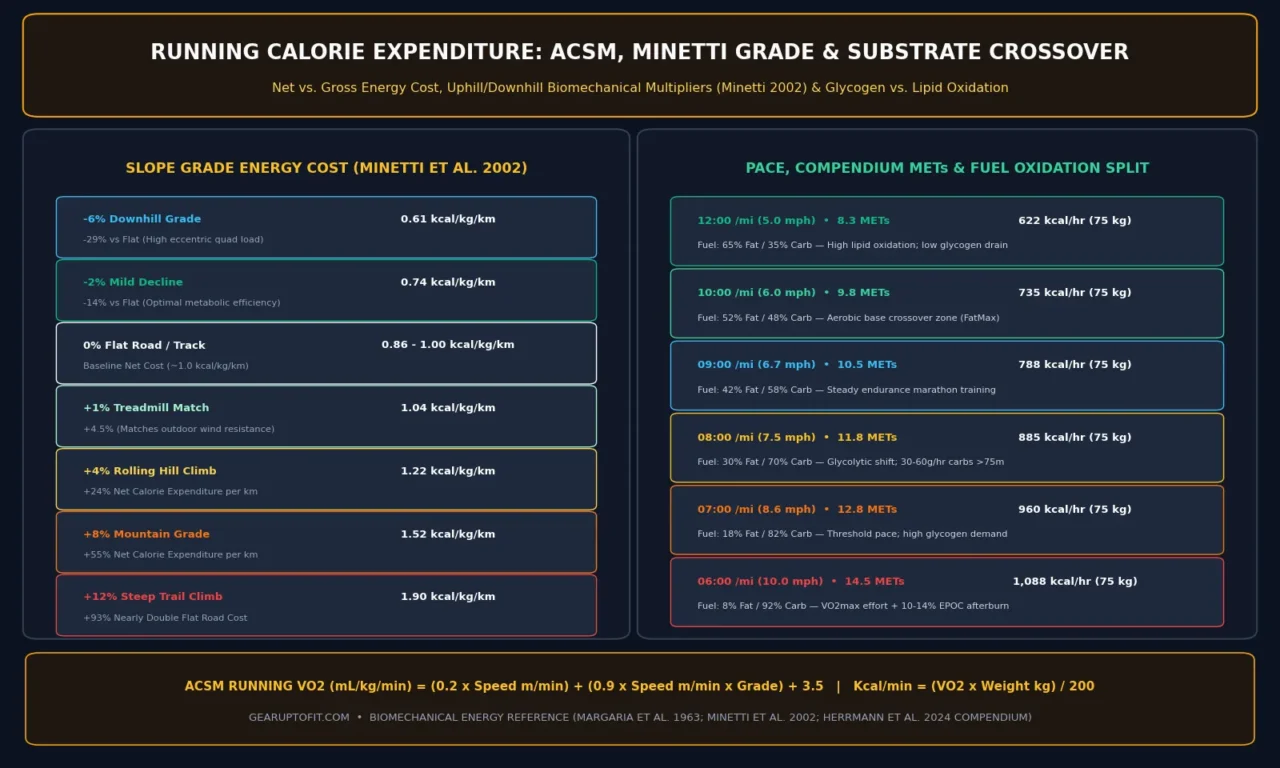
The 3 Validated Scientific Equations Inside Our Calculator
Rather than relying on a single static multiplier, our calculator computes your expenditure across three foundational peer-reviewed models in exercise physiology so you can inspect how laboratory calorimetry equations compare.
1. The ACSM Volumetric Oxygen Uptake (VO2) Equation
Published in ACSM’s Guidelines for Exercise Testing and Prescription (11th Edition), the American College of Sports Medicine partitions steady-state oxygen consumption into three additive components: horizontal locomotion cost, vertical climbing work against gravity, and resting basal metabolism (3.5 mL/kg/min).
Net VO2 (mL/kg/min) = (0.2 × S) + (0.9 × S × G)
Net kcal/min = (Net VO2 × Body Mass in kg) / 1,000 × 5.0 kcal/L O2
Here, S is horizontal speed in meters per minute (1 mph = 26.8224 m/min) and G is the fractional grade (for example, a 5% treadmill incline equals 0.05). Because the horizontal coefficient (0.2 mL O2•kg−1•m−1) is twice as high as the walking horizontal coefficient (0.1), running incurs a much higher metabolic cost per meter due to the aerial flight phase and vertical oscillation of the center of mass—even at slow jogging speeds.
2. Minetti et al. (2002) 5th-Order Polynomial Slope Cost of Transport
While the ACSM linear grade term (0.9 × S × G) works exceptionally well on flat ground and positive inclines, it cannot accurately model downhill running because subtracting a linear grade term implies that steep downhill running requires negative energy. In reality, running down steep grades requires intense eccentric quadriceps braking force.
In a landmark study published in the Journal of Applied Physiology, Alberto Minetti and colleagues (2002) measured the metabolic cost of running on a motorized treadmill across gradients ranging from -45% downhill to +45% uphill. They established the fifth-order polynomial for the net energy cost of running per kilogram per meter (Cr, in J•kg−1•m−1) as a function of fractional slope i:
Net kcal = [ Cr(i) × Body Mass (kg) × Distance (meters) ] / 4,184 J/kcal
On flat ground (i = 0), Minetti’s equation yields 3.6 J•kg−1•m−1, which converts to 0.86 net kcal•kg−1•km−1 for elite/sub-elite mountain runners (or ~0.98 kcal•kg−1•km−1 in recreational runners with standard running economy). Crucially, Minetti’s polynomial shows that the minimum metabolic cost of running occurs around a -2% to -4% gentle decline (where gravity assists forward propulsion without excessive eccentric braking), whereas grades steeper than -10% begin increasing caloric expenditure again.
3. The 2024 Adult Compendium of Physical Activities (METs)
Compiled by Herrmann et al. (2024) in the Journal of Sport and Health Science (updating Ainsworth et al., 2011), the Compendium assigns empirically measured Metabolic Equivalents (METs) to specific running velocities (for example, code 12050 at 6.0 mph = 9.8 METs; code 12080 at 7.5 mph = 11.8 METs; code 12110 at 9.0 mph = 12.8 METs). Using the standard clinical conversion where 1 MET = 1.0 kcal•kg−1•hr−1, our calculator interpolates exact MET values across your speed and adjusts for grade and surface.
Why Do Faster Paces Slightly Increase Calories Burned Per Mile Outdoors?
While classic treadmill calorimery (Margaria et al., 1963) found net energy cost per mile to be nearly independent of speed between 5.5 and 10 mph, modern biomechanics research by Kipp, Kram, and Hoogkamer (2018) demonstrated two reasons why running faster outdoors burns 5% to 12% more calories per mile: (1) nonlinear aerodynamic drag, which scales with the square of velocity (v2) and requires 4% to 8% more oxygen at sub-6:30/mile paces (Pugh, 1970), and (2) curvilinear muscle recruitment, as faster ground contact times force recruitment of less economical Type IIa/IIx fast-twitch motor units and increase respiratory muscle oxygen consumption.
Treadmill Incline & The 1% Rule: How Slope Multiplies Calorie Burn
When you run on an indoor motorized treadmill at 0.0% grade, the belt moves beneath your feet while your torso remains stationary relative to the room air. Because there is no headwind resistance to overcome, running on a flat treadmill requires slightly less oxygen than running at the exact same pace on a flat outdoor track.
In their classic 1996 investigation in the Journal of Sports Sciences, Andrew Jones and Jonathan Doust measured VO2 across six running velocities (from 6.5 mph to 11.2 mph) outdoors versus on a treadmill at 0%, 1%, 2%, and 3% grades. Their findings established the gold-standard rule for indoor training:
- At paces between 7:00/mile and 10:30/mile (5.7 to 8.5 mph): Setting a motorized treadmill to a 1.0% incline exactly matches the oxygen consumption and caloric cost of flat outdoor road running.
- At easy jogging paces slower than 10:30/mile (<5.7 mph): Air resistance outdoors is negligible (<1.5% of total energy cost), so a 0.0% to 0.5% incline already matches outdoor calorie expenditure.
- On steep uphill grades (+5% to +12%): Every +1% increase in treadmill grade adds approximately 9% to 10.5% more net calorie expenditure at a given running speed because your center of mass must be lifted vertically against gravity (9.81 m/s2) with every stride.
Terrain Surface & Weighted Vest (Rucking / Trail) Multipliers
Running economy depends heavily on the elastic energy return of the surface beneath your shoes and the stability required from your ankle, knee, and hip stabilizers. When a surface deforms under footstrike, mechanical energy is dissipated as heat in the ground rather than returned via Achilles tendon and arch recoil:
- Asphalt, Concrete & Synthetic Track (1.00x baseline): High surface stiffness maximizes elastic recoil in modern midsole foams and lower-leg tendons.
- Packed Dirt & Crushed Gravel Paths (1.05x cost): Minor horizontal foot slippage during toe-off increases oxygen cost by roughly 4% to 6%.
- Grass & Cross-Country Turf (1.08x cost): Surface compliance and uneven footing raise metabolic expenditure by ~7% to 9% compared to road running.
- Technical Singletrack Trail (1.12x cost): Stepping over roots, rocks, and camber variations requires continuous lateral stabilization and variable stride lengths, increasing caloric burn by 10% to 15% even before accounting for elevation gain (Voloshina et al., 2013).
- Soft Dry Beach Sand (1.60x cost): Classic physiological studies by Soule & Goldman (1972) and Lejeune, Willems, & Heglund (1998) proved that running on soft dry sand requires 1.55 to 1.65 times more energy than running on firm ground at the same speed due to foot sinkage and lost elastic rebound.
- Weighted Vest / Hydration Pack Load: Carrying external mass on the torso increases metabolic cost linearly with total system mass (Wrunner + Wload), plus a 1.15x postural stabilization penalty when vest loads exceed 10% of body weight (Epstein et al., 1987).
Fat-Burning Zone vs. Glycogen Depletion: Substrate Crossover Explained
One of the most persistent myths in endurance running is that slow jogging in Zone 2 burns more total body fat than running faster in Zone 3 or Zone 4. Understanding the Substrate Crossover Concept (formulated by George Brooks & Jacques Mercier, 1994, and quantified via stable isotope tracers by Romijn et al., 1993) clarifies how your body actually partitions fuel:

- Zone 1–2 Easy Aerobic Running (~55% to 65% VO2max): Your Respiratory Exchange Ratio (RER = VCO2 / VO2) sits around 0.82 to 0.86. Roughly 45% to 60% of your calories come from fat (plasma free fatty acids and intramuscular triglycerides), and 40% to 55% come from muscle glycogen. This is where absolute fat oxidation in grams per minute peaks (the “FatMax” zone)—making it essential for building mitochondrial density without exhausting glycogen reserves. Estimate your exact aerobic heart rate ceiling with our Zone 2 Running Calculator and full Heart Rate Zone Calculator.
- Zone 3–4 Tempo & Threshold Running (~75% to 90% VO2max): Rising catecholamines (epinephrine) and glycolytic flux push RER to 0.91–0.96. Carbohydrate oxidation provides 73% to 90% of total energy. Even though the percentage of fat burned is lower, total caloric expenditure per minute is 35% to 60% higher, and post-exercise oxygen consumption (EPOC) elevates lipid oxidation for hours after you stop running.
- Preventing the Marathon “Bonk” (Glycogen Depletion): A well-fed runner stores roughly 350 to 500 grams of muscle glycogen (~1,400 to 2,000 kcal) and 80 to 100 grams of liver glycogen (~320 to 400 kcal). Because high-intensity running oxidizes 2.5 to 3.8 grams of carbohydrate per minute (150 to 225 g/hr), endogenous glycogen is depleted after 80 to 110 minutes of continuous hard running. For runs lasting 75 minutes to 2.5 hours, sports nutrition guidelines (Jeukendrup, 2014; ACSM) recommend ingesting 30 to 60 grams of carbohydrate per hour (rising to 60 to 90 g/hr via dual-transport glucose:fructose gels for marathons and ultras) alongside electrolyte replacement to match sweat sodium losses.
Running for Weight Loss: The 3,500-Calorie Rule & Compensation Traps
Historically, Max Wishnofsky (1958) established that one pound (454 g) of human adipose tissue (~87% lipid, 13% water and connective tissue) contains roughly 3,500 kilocalories of metabolizable energy (7,716 kcal/kg). If you run 5 miles four times per week at 165 lbs, you expend roughly 2,144 net kcal/week—theoretically equating to 0.61 lbs of fat loss per week (or ~7.3 lbs over 12 weeks).
However, controlled clinical trials (Ross et al., 2000; Hall et al., 2011; Pontzer et al., 2016) reveal two reasons why real-world weight loss from running often lags behind raw math unless paired with nutrition tracking:
- Post-Exercise Appetite Compensation: High-volume running stimulates ghrelin and reward-driven hunger. Runners who eat ad libitum (without tracking intake) subconsciously consume an extra 20% to 35% of the calories they burned—easily erasing a 400-kcal run with a single post-run pastry or oversized smoothie. Use our Macronutrient Calculator for Weight Loss to lock in a sustainable calorie deficit.
- Protecting Lean Muscle Mass: Running in a steep caloric deficit without adequate dietary protein increases skeletal muscle catabolism. To ensure weight lost comes from adipose fat rather than lean muscle, maintain a daily protein intake of 1.6 to 2.2 grams per kilogram of body weight (see our Protein Intake Guide and track your fat-free mass with our Lean Body Mass Calculator).
Wearable Accuracy & Recommended Running Gear
How accurate is your GPS watch at estimating calories? A Stanford University validation study by Shcherbina et al. (2017) and a systematic meta-analysis by O’Driscoll et al. (2020) evaluated wrist-worn wearables against laboratory indirect calorimetry (metabolic carts). They found that optical wrist wearables exhibit a mean absolute percentage error (MAPE) of 15% to 28% for energy expenditure—primarily because wrist optical PPG sensors struggle with motion cadence lock and because algorithms bundle resting BMR with active expenditure.
Pairing a multi-band GPS running watch (for precise pace and grade-adjusted velocity) with a chest-strap ECG heart rate sensor (such as the Garmin HRM 600) reduces heart-rate-derived metabolic error by more than half. Below are two high-utility tools for tracking your expenditure and fueling long runs accurately:

Garmin Forerunner 165 GPS Running Watch
Separates Active (Net) Calories from Resting Calories in Garmin Connect, tracks barometric elevation gain, and provides PacePro grade-adjusted pacing.

Carbs Fuel Original 50g Energy Gel
Delivers 50 grams of dual-source maltodextrin + fructose (2:1 ratio, 200 kcal) per pouch so you can hit 50–90g/hr fueling targets with a single gel per hour.
For runners comparing higher-tier training metrics like Training Readiness and multi-band GNSS, read our Garmin Forerunner 265 Review, our roundup of the Best Smartwatches for Runners, and our biomechanics guide to the Best Running Shoes.
Frequently Asked Questions About Running Calories
Does running faster burn more calories for the same distance?
Over a fixed distance (such as 1 mile or a 5K), running faster increases your net calories per mile by only 3% to 8%—primarily due to quadratic wind resistance (v2) and higher fast-twitch motor unit recruitment at paces faster than 7:00/mile (Kipp et al., 2018). However, over a fixed time duration (such as a 30-minute or 45-minute run), running faster burns dramatically more calories because you cover significantly more distance in that same time window.
Why does my Apple Watch or Garmin show 15% more calories than this calculator’s Net number?
Most wrist wearables display Total (Gross) Calories as their headline workout metric, which adds your basal resting metabolic rate (~1.0 to 1.3 kcal/min) on top of the active calories burned by running. Compare your watch’s “Active Calories” field to our Net Running Calories readout, and compare its “Total Calories” field to our Gross Total Calories readout.
How many calories does running 1 mile, a 5K, or a 10K burn?
For a 165-lb (75 kg) runner on flat pavement: 1 mile burns approximately 107 net kcal (119 gross kcal); a 5K (3.11 miles) burns 333 net kcal (370 gross kcal); and a 10K (6.21 miles) burns 666 net kcal (740 gross kcal). A 130-lb (59 kg) runner burns roughly 85 net kcal/mile (264 kcal per 5K), while a 200-lb (91 kg) runner burns roughly 130 net kcal/mile (404 kcal per 5K).
Does running on a treadmill burn fewer calories than running outside?
At a 0.0% treadmill incline, you burn roughly 4% to 8% fewer calories than running outdoors at the same pace (between 7:00 and 10:00/mile) because there is no headwind drag on a stationary belt. Setting the treadmill to a 1.0% incline (Jones & Doust, 1996) equalizes the oxygen demand and calorie expenditure with flat outdoor road running.
Does downhill running burn fewer calories than flat running?
Yes, up to a point. According to Minetti et al. (2002), gentle downhill grades between -1% and -5% reduce net calorie expenditure by 15% to 28% compared to flat running because gravity assists forward propulsion. However, on very steep downhill grades beyond -10% to -15%, intense eccentric braking forces in the quadriceps cause metabolic cost to rise back up while inducing significant delayed-onset muscle soreness (DOMS).
How much does wearing a weighted vest increase running calorie burn?
Adding a weighted vest or running pack increases net energy expenditure in direct proportion to the added percentage of total system mass, plus an additional 10% to 15% stabilization cost when loads exceed 10% of body weight (Epstein et al., 1987). For a 165-lb runner, a 15-lb vest (+9.1% mass) increases net burn by roughly 10 to 12 kcal per mile—though exercise physiologists generally advise reserving weighted vests for incline walking/rucking to minimize peak tibial impact forces.
How many miles do I need to run to lose 1 pound of body fat?
Because 1 pound of human adipose tissue stores roughly 3,500 kilocalories, a 165-lb runner burning 107 net kcal/mile must run approximately 32.7 miles (assuming 0% dietary compensation, meaning you do not eat extra calories to offset the exercise). If you check your target weight on our Ideal Body Weight (IBW) Calculator or BMI, BMR & WHR Calculator, combining 15–20 miles of weekly running with a modest 300-kcal daily nutrition deficit is the most sustainable way to lose 1.0 to 1.2 lbs per week.
Scientific References & Peer-Reviewed Literature
- American College of Sports Medicine (ACSM). (2021). ACSM’s Guidelines for Exercise Testing and Prescription (11th ed.). Wolters Kluwer. (Metabolic equations for horizontal and grade running: VO2 = 0.2S + 0.9SG + 3.5).
- Minetti, A. E., Moia, C., Roi, G. S., Susta, D., & Ferretti, G. (2002). Energy cost of walking and running at extreme uphill and downhill slopes. Journal of Applied Physiology, 93(3), 1039–1046.
- Herrmann, S. D., Willis, E. A., Ainsworth, B. E., Barreira, T. V., et al. (2024). 2024 Adult Compendium of Physical Activities: A third update of the energy costs of human activities. Journal of Sport and Health Science, 13(1), 6–12.
- Margaria, R., Cerretelli, P., Aghemo, P., & Sassi, G. (1963). Energy cost of running. Journal of Applied Physiology, 18(2), 367–370.
- Jones, A. M., & Doust, J. H. (1996). A 1% treadmill grade most accurately reflects the energetic cost of outdoor running. Journal of Sports Sciences, 14(4), 321–327.
- Kipp, S., Kram, R., & Hoogkamer, W. (2018). Extrapolating metabolic savings in running: implications for performance predictions. Frontiers in Physiology, 9, 79.
- Romijn, J. A., Coyle, E. F., Sidossis, L. S., et al. (1993). Regulation of endogenous fat and carbohydrate metabolism in relation to exercise intensity and duration. American Journal of Physiology-Endocrinology and Metabolism, 265(3), E380–E391.
- Brooks, G. A., & Mercier, J. (1994). Balance of carbohydrate and lipid utilization during exercise: the “crossover” concept. Journal of Applied Physiology, 76(6), 2253–2261.
- Soule, R. G., & Goldman, R. F. (1972). Terrain coefficients for energy cost prediction. Journal of Applied Physiology, 32(5), 706–708.
- LaForgia, J., Withers, R. T., & Gore, C. J. (2006). Effects of exercise intensity and duration on the excess post-exercise oxygen consumption. Journal of Sports Sciences, 24(12), 1247–1264.